Choropleth map

Results: 321


#Item
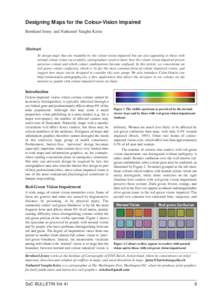
31Designing Maps for the Colour-Vision Impaired Bernhard Jenny and Nathaniel Vaughn Kelso Abstract To design maps that are readable by the colour-vision impaired but are also appealing to those with normal colour vision su

Designing Maps for the Colour-Vision Impaired Bernhard Jenny and Nathaniel Vaughn Kelso Abstract To design maps that are readable by the colour-vision impaired but are also appealing to those with normal colour vision su

Add to Reading List

Source URL: www.colororacle.org

Language: English - Date: 2013-04-18 20:11:24
32Color Design for the Color Vision Impaired

Color Design for the Color Vision Impaired

Add to Reading List

Source URL: www.colororacle.org

Language: English - Date: 2013-04-18 20:11:24
33Multivariate Mapping in High Quality Atlases

Multivariate Mapping in High Quality Atlases

Add to Reading List

Source URL: www.topoi.ch

Language: English - Date: 2011-01-28 04:22:32
34than 90 or 95 percent white. Of course, estimates for the somewhat smaller, more narrowly defined white, nonHispanic segment of the population would have yielded more meaningful minority clusters, based on ethnicity as w

than 90 or 95 percent white. Of course, estimates for the somewhat smaller, more narrowly defined white, nonHispanic segment of the population would have yielded more meaningful minority clusters, based on ethnicity as w

Add to Reading List

Source URL: mason.gmu.edu

Language: English - Date: 1999-10-14 16:00:07
35CAWT - OUTCOMES FOR CHILDREN PROJECT  Outcomes for Children Project Interactive Mapping Tool User Guide V.2

CAWT - OUTCOMES FOR CHILDREN PROJECT Outcomes for Children Project Interactive Mapping Tool User Guide V.2

Add to Reading List

Source URL: www.outcomesforchildren.org

Language: English - Date: 2014-03-11 06:38:48
36Monmonier, M. 1991. “How to Lie with Maps.” Chicago: University of Chicago Press. Monmonier, M. 1993. “Mapping It Out.” Chicago: University of Chicago Press. Muller, J. C. (Ed[removed]. “Cognitive cartography: A

Monmonier, M. 1991. “How to Lie with Maps.” Chicago: University of Chicago Press. Monmonier, M. 1993. “Mapping It Out.” Chicago: University of Chicago Press. Muller, J. C. (Ed[removed]. “Cognitive cartography: A

Add to Reading List

Source URL: mason.gmu.edu

Language: English - Date: 1999-10-14 16:00:10
37Choropleth map / Australia / Probability distribution / Earth / Geography / Cartography / Dot distribution map / Maps

RTF Document

Add to Reading List

Source URL: www.abs.gov.au

Language: English - Date: 2013-11-21 19:31:26
38Earth / Political geography / Cartography / Choropleth map / Australia

RTF Document

Add to Reading List

Source URL: www.abs.gov.au

Language: English - Date: 2013-11-21 19:30:46
39Microsoft Word - RothEtAl_ValueByAlphaMaps_full

Microsoft Word - RothEtAl_ValueByAlphaMaps_full

Add to Reading List

Source URL: www.geovista.psu.edu

Language: English - Date: 2011-05-10 14:13:02
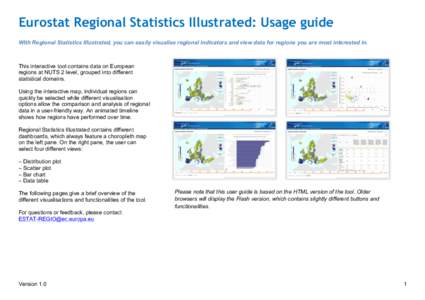
40Eurostat Regional Statistics Illustrated: Usage guide With Regional Statistics Illustrated, you can easily visualise regional indicators and view data for regions you are most interested in. This interactive tool contain

Eurostat Regional Statistics Illustrated: Usage guide With Regional Statistics Illustrated, you can easily visualise regional indicators and view data for regions you are most interested in. This interactive tool contain

Add to Reading List

Source URL: ec.europa.eu

Language: English - Date: 2013-07-22 12:00:46